The State of U.S. Farmers Markets 2026
How many farmers markets are there in 2026?
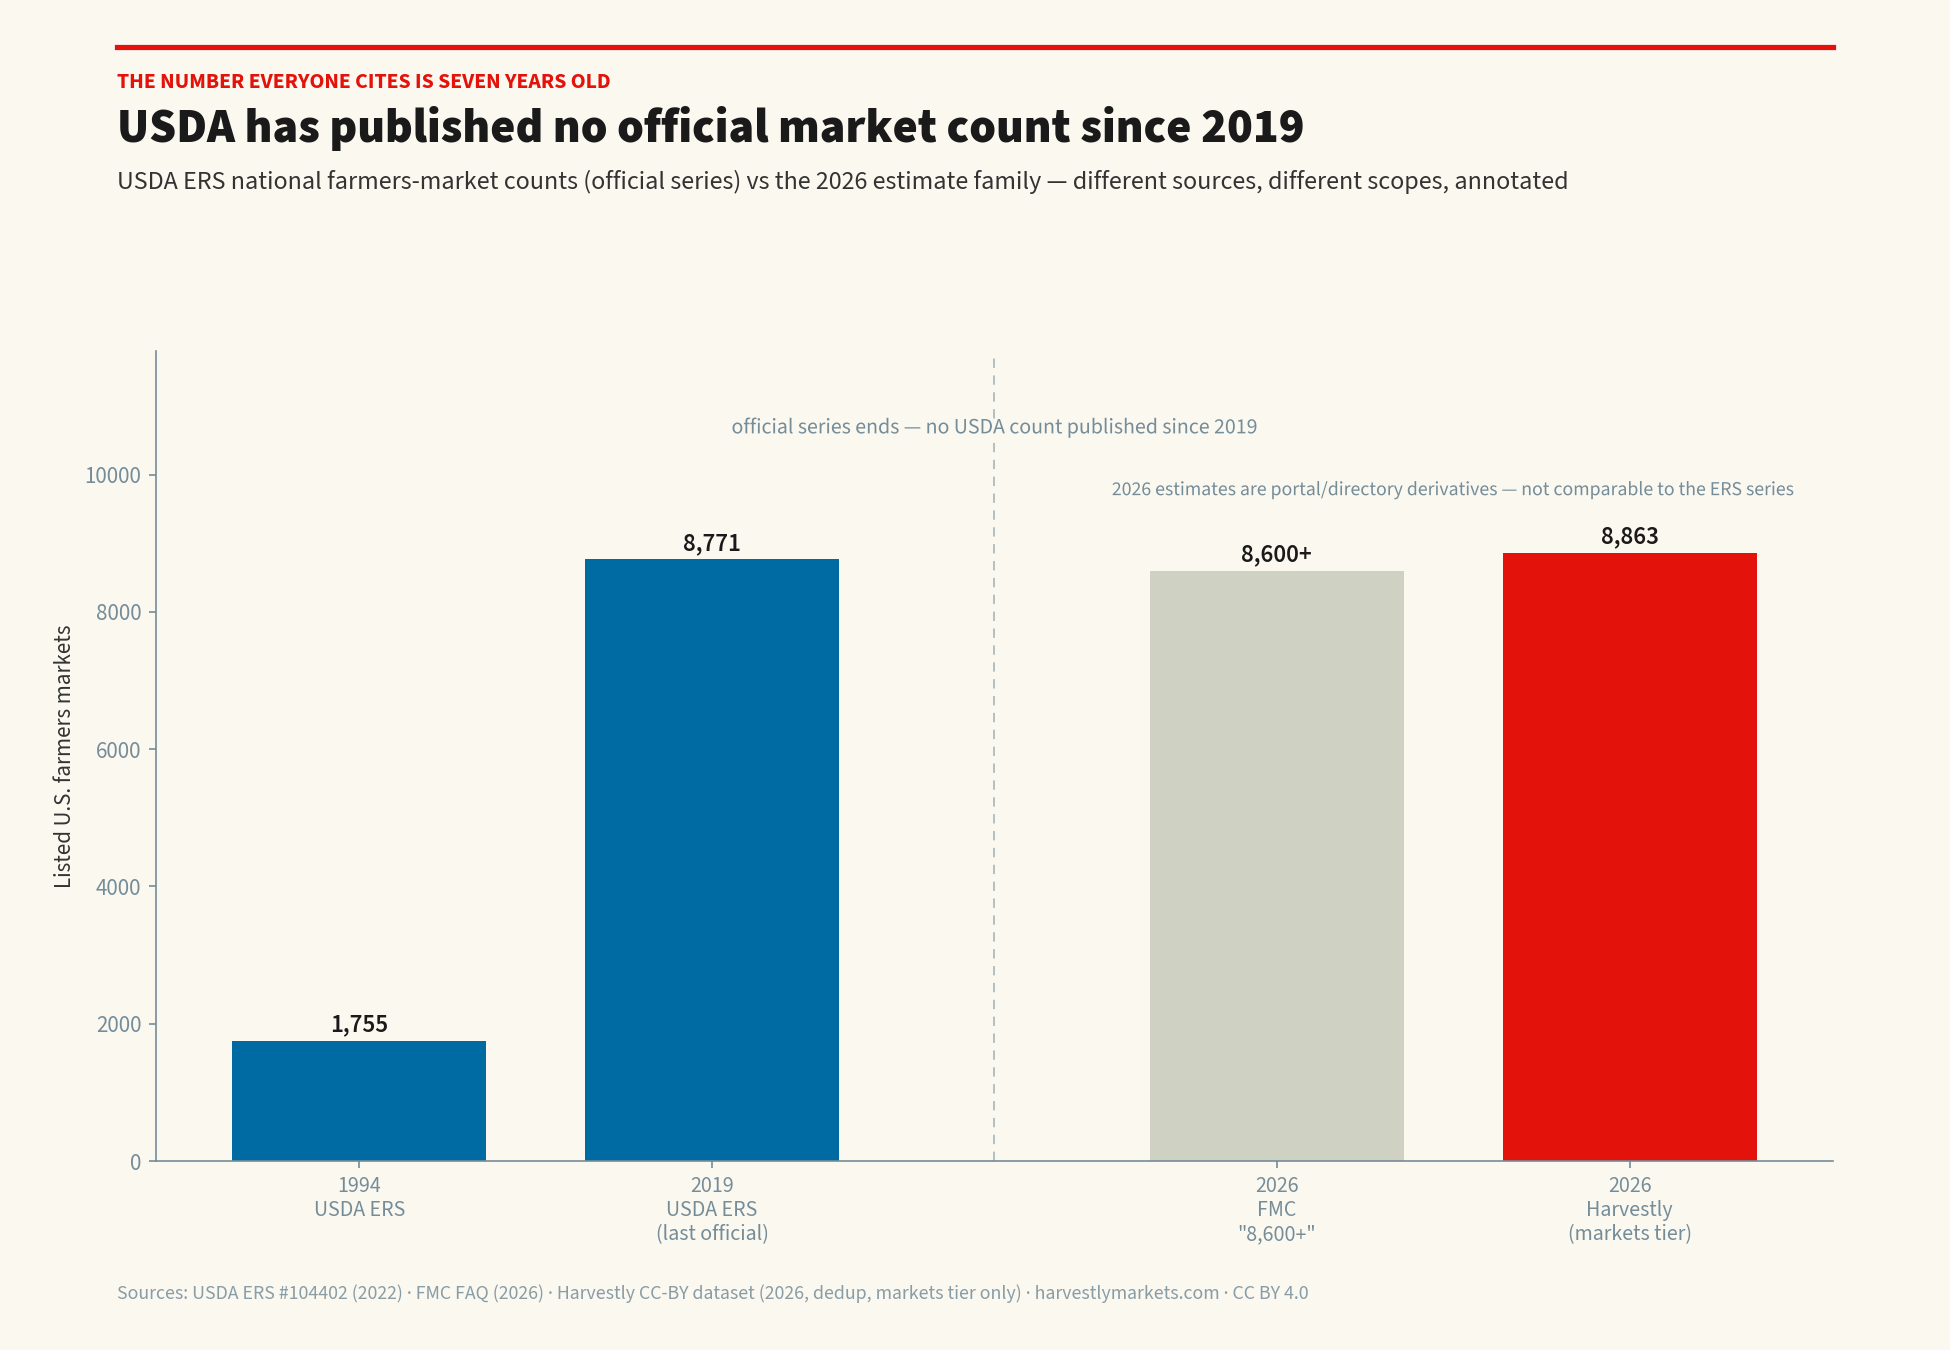
The most basic question about American farmers markets has no official answer. The USDA Economic Research Service's national count series ends at 8,771 markets in 2019; no successor figure has been published since. What exists in 2026 is an estimate family: the Farmers Market Coalition cites "8,600+", and our own cleaned dataset lists 7,947.
The plateau, told honestly
From 1,755 markets in 1994 to 8,771 in 2019, the sector averaged roughly 7% growth per year — one of the great quiet expansions in American food retail. But USDA ERS records the deceleration starting in 2011, with annual growth falling below 1% between 2016 and 2017 and staying "modest and stable" since. ERS attributes the flattening not to collapse but to local food moving into intermediated channels — grocery stores, restaurants, distributors — while academic work (a 2023 Cornell thesis building on Bonanno et al.) finds regional market density exceeding demand in places, thinning per-vendor sales.
The claim that "farmers markets are booming" is the single most repeated error in coverage of the sector. The honest 2026 description: a mature, saturated network holding steady — resilient through COVID, adopting online pre-order and mobile point-of-sale permanently, and consolidating in some regions toward fewer, stronger flagship markets.
The economics correction: 81% is not direct-to-consumer
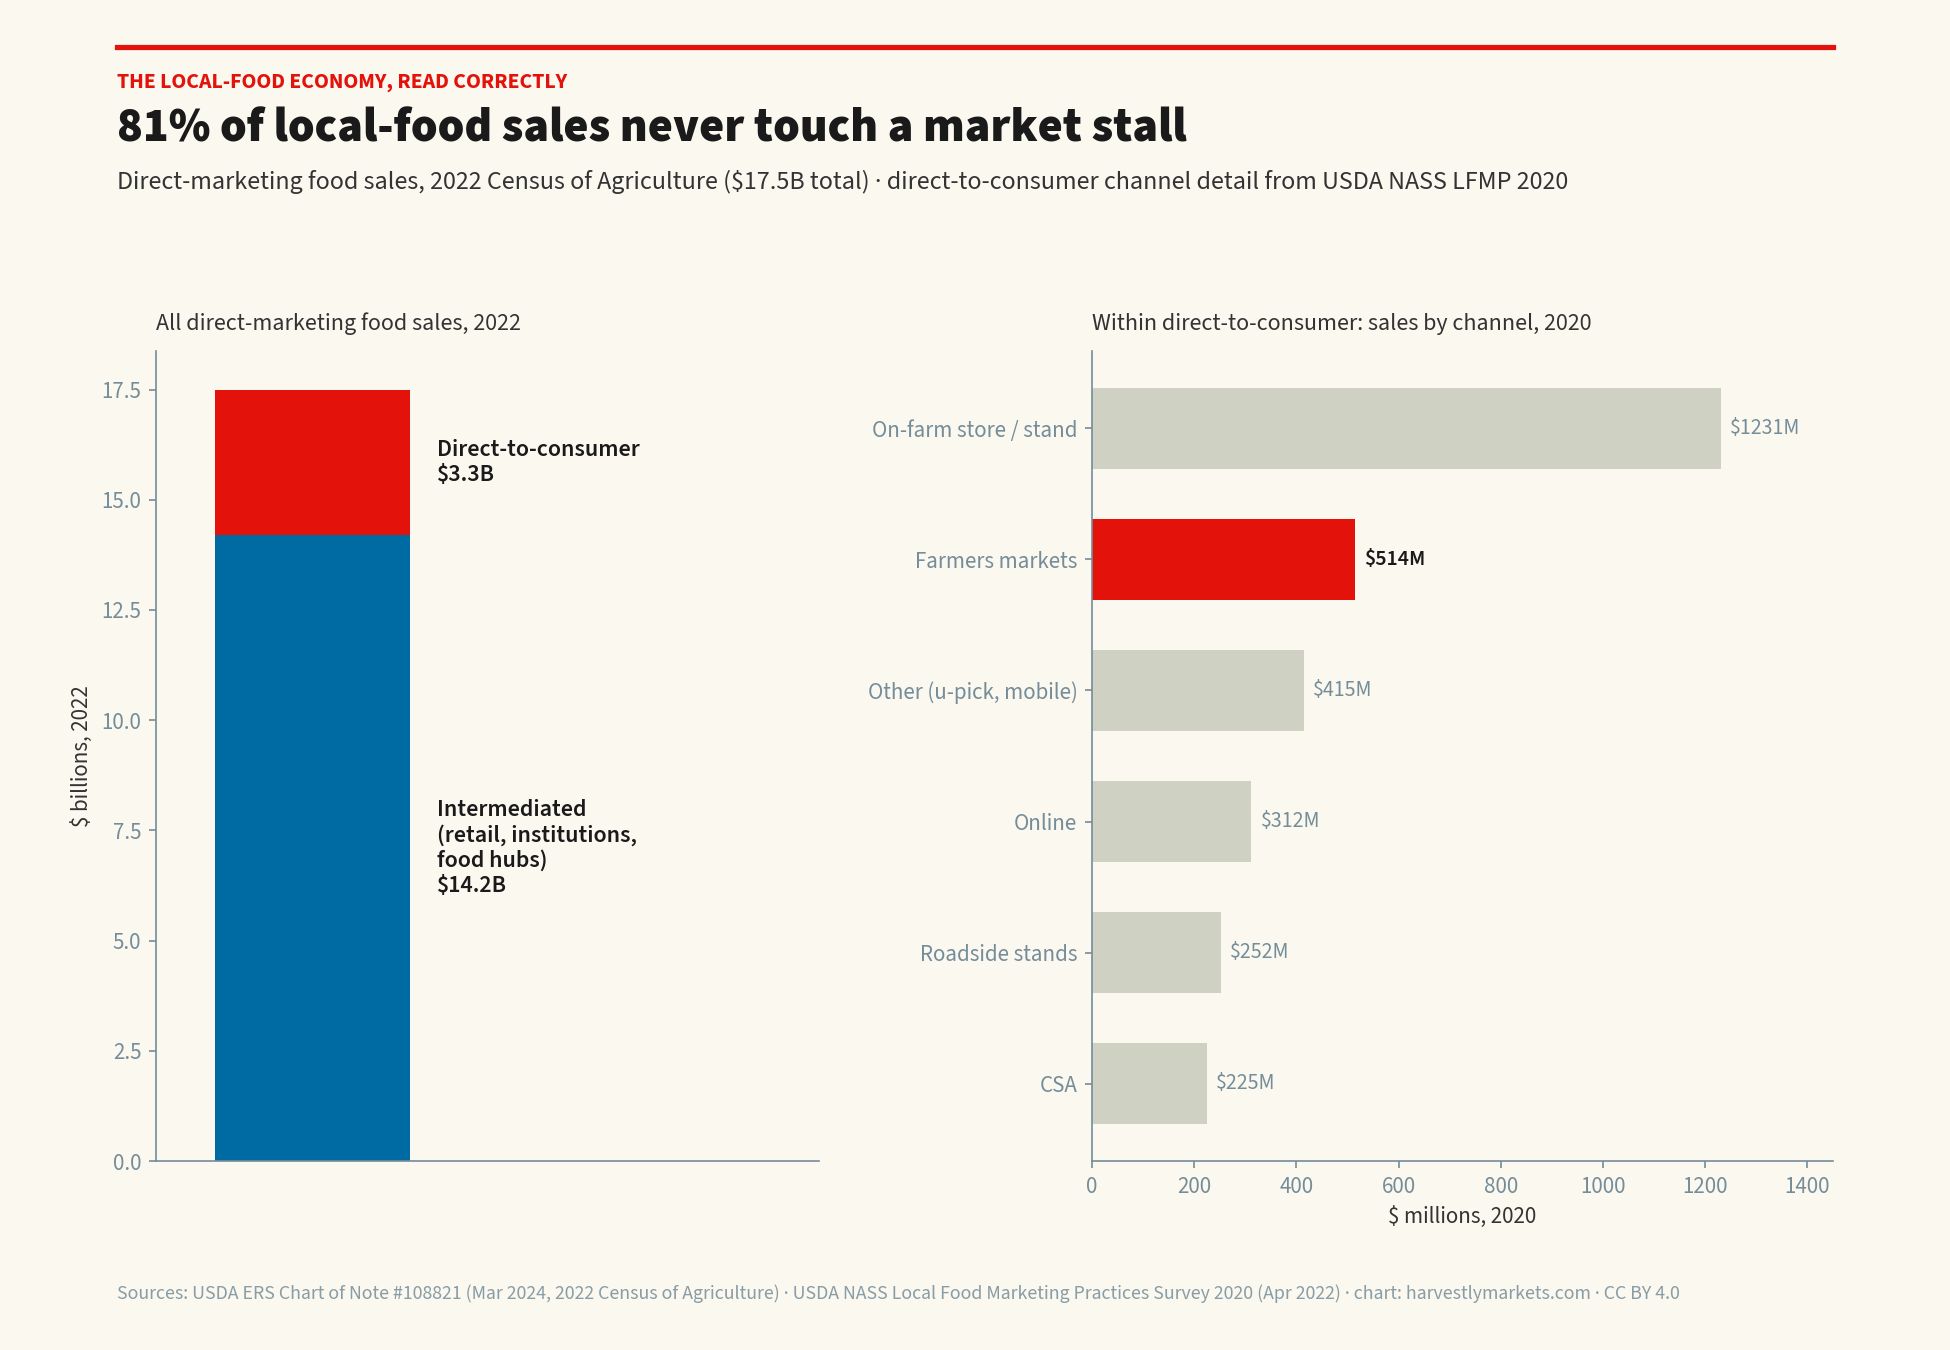
The 2022 Census of Agriculture (released February 2024) counted $17.5 billion in direct-marketing food sales — up 25% inflation-adjusted since 2017. But $14.2 billion of it (81%) flowed through intermediated and wholesale channels: retail, institutions, food hubs. True direct-to-consumer sales were $3.3 billion — flat after inflation. And within DTC, farmers markets themselves took $514 million in 2020 (USDA NASS Local Food Marketing Practices Survey) — behind on-farm stores ($1.23 billion) and barely ahead of u-pick and mobile channels combined.
Two more census facts worth carrying into any 2026 story. First, the number of farms selling direct-to-consumer fell between 2017 and 2022 — −10.3% by ERS's accounting; −19% by the National Sustainable Agriculture Coalition's (the two analyses use different bases; we present both rather than average them). Second, that decline largely mirrors the shrinking total number of U.S. farms: the share of farms doing DTC has held near 6% across 2012, 2017, and 2022. Local food isn't dying — its denominator is.
None of this diminishes what markets do. It corrects what they are: the cultural front door and the highest-touch retail surface of a local-food economy whose dollar growth happens mostly out of sight, in wholesale.
2026: the policy watershed
August 2026 — National Farmers Market Week runs August 2–8 — is the first peak market season under a fundamentally changed federal food-policy regime. Four changes matter most:
- The One Big Beautiful Bill Act (H.R. 1, P.L. 119-21, signed July 4, 2025) cut SNAP by $186 billion over the budget window, froze Thrifty Food Plan updates until October 2027, and extended work requirements to ages 18–64, including parents of children 14 and older. The Food Research & Action Center projects an 8.7% average decline in SNAP-related retail sales.
- SNAP-Ed was eliminated effective October 1, 2025. The national nutrition-education program that many markets leaned on for outreach and low-income customer acquisition is gone — NFMW 2026 is the first market week without it.
- The November 2025 government shutdown temporarily paused SNAP benefit distribution, leaving lingering retailer and participant uncertainty even though SNAP is funded through FY2026.
- USDA's Food and Nutrition Service became the Food and Nutrition Administration (FNA) on June 1, 2026. A small change with a practical use: any 2026 document still citing "FNS" predates the rename.
And the next shocks are already scheduled: on October 1, 2027, states' share of SNAP administrative costs rises from 50% to 75%, and starting FY2028, states with payment error rates above 6% begin paying 5–15% of benefit costs themselves (per NSAC's analysis of the law). State legislatures are drafting those budgets now — which is why 2026, not 2027, is when market-adjacent SNAP infrastructure gets decided.
SNAP at the market: small dollars, big stakes
SNAP redemptions at farmers markets grew from roughly $11 million in 2011 (Farmers Market Coalition) to an estimated $70+ million in 2023 (a House Agriculture Committee estimate — no official 2026 figure exists). That's a rounding error against an $80B+ program and a six-fold rise for market economics — precisely the revenue line the 2025 law now squeezes. Incentive programs concentrate the stakes: GusNIP has put $330M+ into 250+ nutrition-incentive projects from 2019–2024, and Double Up Food Bucks alone operates at 1,700+ locations in 25 states — Michigan's 2025 program moved $12.4M in fruit and vegetable purchases across 190,463 households.
Our own listings put ground-level texture on this: 11.4% of U.S. farmers markets (904) indicate SNAP/EBT acceptance in 2026 — a figure that undercounts reality, since directory data lags what markets actually do at the booth. Read it as a floor, not a ceiling. (Our full per-state SNAP breakdown is on the statistics hub.)
What our 2026 state-level data shows
Beneath the flat national line, the state-level picture is anything but uniform. From our 7,947-market dataset:
- California has the most farmers markets (647) — the only by-count superlative the data cleanly supports.
- Per capita, small northern states dominate: Vermont, Wyoming, Alaska, District Of Columbia, Montana lead the markets-per-100k-residents ranking (states with ≥10 markets). Density, not population, is the local-food story.
- 43.1% of markets have a working website in 2026 — meaning roughly half of America's farmers markets are effectively invisible to online-first shoppers. This is the sector's most fixable problem.
- 13.2% of markets indicate certified-organic vendors, and 11.4% indicate SNAP/EBT acceptance — both listed-data floors.
Every number above is computed from the same dataset you can download — per-state CSV and JSON on the statistics hub, sources and methodology on data sources, all CC BY 4.0. State detail lives on the per-state statistics pages (e.g. California, Vermont) and the state directories (browse all states).
What to watch through 2028
- Now–late 2026: state budget drafting for the SNAP admin cost-share shift — the quiet decisions that determine market-adjacent SNAP infrastructure.
- August 2–8, 2026: National Farmers Market Week — the first under the new SNAP regime and the first without SNAP-Ed.
- Next farm bill: Fair Food Network and allies are seeking permanent GusNIP funding at $250M over five years; GusNIP's evaluation arm is piloting simplified participant metrics through 2026.
- October 1, 2027: state SNAP admin cost share rises to 75%.
- FY2028: error-rate-based benefit cost-sharing begins for states above 6% payment error.
Definitions & scope
- Farmers market (this dataset): a recurring, multi-vendor market selling farm products directly to consumers, as listed in the USDA AMS Local Food Portal or a state directory. Single-farm stands, u-pick operations, and CSA programs are tracked in separate tiers and never counted in the market total.
- "Local" (USDA NASS): food transported under 400 miles, or sold within its state of origin. Quoted here because the $9B/2020 and channel figures depend on it.
- Direct-to-consumer (DTC): sales from farm to end consumer — markets, on-farm stores, CSAs, roadside stands, online. Intermediated: sales through retail, institutions, and food hubs.
- Listed data: attributes like SNAP acceptance and websites reflect what directories record. They undercount reality and are presented as floors.
Methodology & data
Harvestly Markets figures: USDA AMS Local Food Portal snapshot plus cleaned state-directory records, deduplicated (7,947 markets across 52 states and DC as of the July 2026 build), with injected non-market records filtered by a build-time classifier. Enrichment (websites, SNAP, organic, hours) is refreshed from live sources; per-state coverage varies and is documented on data sources. External figures are attributed inline with source and date, presented without blending; where authoritative sources conflict (e.g., the DTC farm-count decline), both figures appear with attribution. The dataset is published under CC BY 4.0 with DOI, mirrored on Zenodo, Hugging Face, Kaggle, GitHub, and DataHub — download links on the statistics hub. Both charts on this page are original and free to reuse with attribution.
Frequently asked questions
How many farmers markets are there in the United States in 2026?
There is no official 2026 count — USDA's last authoritative national figure was 8,771 markets in 2019, and no successor number has been published. Current estimates cluster in the same range: the Farmers Market Coalition cites "8,600+", and Harvestly Markets' cleaned, deduplicated 2026 dataset — derived from the USDA AMS Local Food Portal plus state directories — lists 7,947 farmers markets (counting farmers markets only; CSAs and farm stands are tracked separately). That figure fell from 8,863 in July 2026 after we removed 512 duplicate registry listings and 400 records that were individual farms or vendors mis-filed as markets, with a handful of further operator-verified merges since. These estimates come from directory data and are not directly comparable to the discontinued official series.
Are farmers markets growing or declining in 2026?
Neither — the honest word is plateaued. USDA ERS data shows market counts grew roughly 7% per year from 1994 (1,755 markets) to 2019 (8,771), but growth decelerated from 2011 and fell below 1% per year around 2016–2017. ERS attributes the plateau to local food shifting into grocery stores, restaurants, and food hubs rather than to sector collapse.
How much do farmers markets actually sell?
In the 2020 USDA NASS Local Food Marketing Practices Survey, farmers markets accounted for $514 million of the $2.9 billion in direct-to-consumer local food sales — about 18% of DTC, and a small slice of the $9 billion total local-food economy that year. In the 2022 Census of Agriculture, 81% of the $17.5 billion in direct-marketing food sales flowed through intermediated channels (retail, institutions, food hubs), not direct-to-consumer channels like markets.
Do farmers markets take SNAP/EBT in 2026?
Many do — in Harvestly Markets' 2026 listings, about 11.4% of U.S. farmers markets (904 markets) indicate SNAP/EBT acceptance, and the true share is likely higher since directory data undercounts. SNAP redemptions at markets grew from roughly $11 million in 2011 to an estimated $70+ million in 2023. The 2025–2026 policy environment puts this at risk: the July 2025 budget law cut SNAP by $186 billion over the budget window, and SNAP-Ed — the education program many markets used for outreach — was eliminated effective October 1, 2025.
What changed for farmers markets in 2025 and 2026?
Four things: (1) the One Big Beautiful Bill Act (signed July 4, 2025) cut SNAP by $186 billion and extended work requirements; (2) SNAP-Ed was eliminated effective October 1, 2025, removing the nutrition-education funding markets used for outreach; (3) the November 2025 government shutdown temporarily paused SNAP benefits; and (4) USDA's Food and Nutrition Service was renamed the Food and Nutrition Administration (FNA) on June 1, 2026. August 2026 is the first peak market season under the new SNAP regime.
Sources
- USDA ERS — Chart of Note #104402: Number of U.S. farmers markets, 1994–2019 (2022)
- USDA ERS — Chart of Note #108821: Direct-marketing food sales, 2022 Census of Agriculture (Mar 2024)
- USDA NASS — Local Food Marketing Practices Survey 2020, Highlights (Apr 2022)
- Farmers Market Coalition — Market FAQ (2026)
- USDA NIFA — Gus Schumacher Nutrition Incentive Program (GusNIP)
- Fair Food Network — Double Up Food Bucks
Figures from the Food Research & Action Center (SNAP retail-sales projection), the National Sustainable Agriculture Coalition (census analysis, state cost-share provisions), the House Agriculture Committee (2023 SNAP-redemption estimate), a 2023 Cornell University M.S. thesis (market-density findings), and Project for Public Spaces/GrowNYC (post-pandemic market assessment) are attributed inline. A note from the Editor: this report states plainly where official data ends and estimates begin; it is checked against its primary sources and updated as newer data becomes available.